
GenAI Security, Agentic AI Security platform Service
GenAI and Agentic AI Security platform as Service
Effective enterprise architecture practices deliver remarkable IT and business benefits.
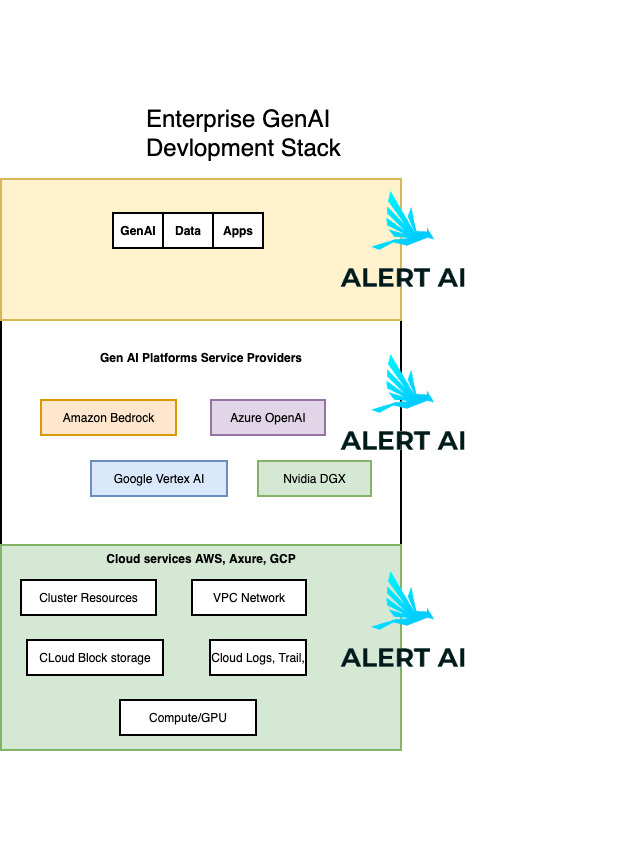
Today’s Enterprise Architectures are driving Organizations AI Transformation.
A remarkable pattern of Enterprise Architecture is Architectural layers and Separation of Concerns.
When it comes to Generative AI in Business, Enterprise architecture layers are Business, Data, Technology, and Application.
And, concerns are of Scalability, Availability, and Security.
GenAI, AI Agents, Data for Business – Security Concern
In the world of Enterprise application architecture, It’s all about connecting any combination cloud-based processes, Cloud services, Applications and Data
Enabling Generative AI in Business Applications is enabling development, execution and governance of integration between GenAI applications are Enterprise Applications and Data.
Architecture layers looks like:
- Data
- Business Intelligence
- GenAI and Agentic AI Platforms, Libraries, Service Providers
The Final layer is Security,
- Security service for Generative AI applications
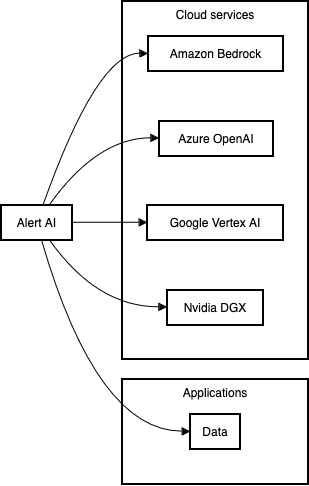
Alert AI (hosted on choice of their cloud in customer’s account) integrates
seamlessly with all three layers plus Domain-specific guardrails).
Considering the integrations with GenAI platforms, libraries, services with Gen AI Stack ..
Alert AI – “Generative AI Security services”, fits into the remarkable Enterprise GenAI Application Architecture and Effective GenAI and Data security integrations, as you build and run on any Platform, any LLM.
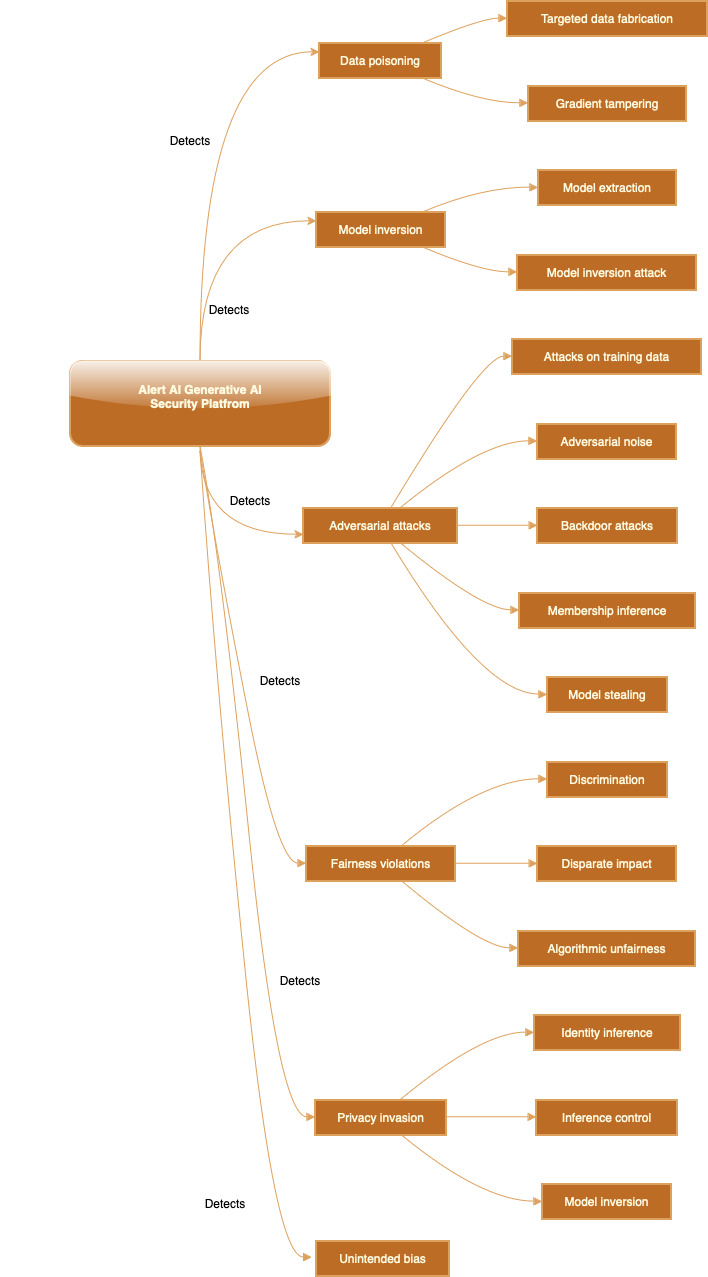
Strategies for new Risks
Alert AI, at its core, is a breed of new generation security platforms, in the era of AI, catering Enterprise needs, augmenting Defenses.
Modern Enterprises Architectures use best of breed models and platforms that best suit the problem. Indeed, they use multiple platforms for Generative AI development.
They want a Security for their AI applications whatever the underlying Gen AI cloud platform, they choose to use multiple Gen AI platforms in most cases.
Alert AI security services – integrates seamlessly with Gen AI platforms, Libraries, Services of your choice.
Alert AI domain-specific security guardrails enhance, optimize security for Generative AI applications and workflows in Business.
Security insights from Application Metrics in Generative AI Landscape
Applications typically provide several key metrics to help developers monitor and optimize the performance of generative AI models. These metrics are crucial for understanding efficiency, accuracy, and overall behavior of the models in production. Many of these Metrics can be used for Security features extraction, aggregation, sessionization, feature anomaly detection, security analytics.
Breaking down some of metrics provided by applications built on various platforms.
AWS Bedrock
Amazon Web Services introduced AWS Bedrock, a fully managed service that makes it simple for developers to create and scale generative AI applications. It provides access to foundation models from leading AI startups and AWS, enabling the creation of applications for various use cases like text generation, chatbots, image creation, and more. AWS Bedrock eliminates the complexities of managing the infrastructure, allowing developers to focus on fine-tuning models and integrating them into their applications. By offering flexible APIs and integration with other AWS services, Bedrock empowers organizations to harness the power of generative AI at scale, without needing deep expertise in machine learning.
Metrics Provided by AWS Bedrock
Model Drift
Description
Model drift measures the change in model performance over time as the data distribution changes. This metric is vital for the long-term maintenance of the model to ensure it continues to perform well in production.
Range
Model drift is typically measured as a percentage change in key performance metrics like accuracy or error rate over time. A higher percentage indicates more significant drift, which may require model retraining or updates.
Inference Latency
Description
Inference latency measures the time taken for the model to process an input and generate a response. This metric is crucial for applications where response time is critical such as chatbots or real-time image generation.
Range
Latency is usually measured in milliseconds (ms). Ideal ranges vary depending on the application, but lower latency (e.g) under 100ms) is often preferred for real-time applications.
Model Throughput
Description
Throughput refers to the number of inferences a model can handle per second. It’s an essential metric for understanding the scalability of your application and ensuring that it can handle the required load.
Range
Throughput refers to the number of inferences per second (IPS). Higher values indicate better scalability. Depending on the model complexity, throughput can range from tens to thousands of IPS.
Accuracy
Description
Accuracy measures the correctness of the model’s predictions or output. This metric is vital for applications where the quality of the generated content directly impacts the user experience such as text generation or recommendation systems.
Range
Accuracy is typically expressed as a percentage or a score between 0 and 1. Higher accuracy (closer to 1 or 100%) indicates better performance, but this metric can vary based on the specific task and dataset.
Resource Utilization
Description
This metric tracks the computational resources ( CPU, GPU memory) used by the model during the inference process. Monitoring resource utilization helps in optimizing costs and ensuring that the application runs efficiently.
Range
Resource utilization is measured in percentages, indicating the proportion of available resources being used. Ideally, resource utilization should be optimized to balance performance and cost.
Error rate
Description
Error rate indicates the frequency of errors encountered during model inference. This metric is critical for maintaining reliability and identifying potential issues with model performance.
Range
The error rate is usually expressed as a percentage. Lower error rates (e.g., below 1%) are preferred, indicating more reliable model performance.
Cost per Inference
Description
This metric measures the cost associated with each inference performed by the model. It’s essential for budgeting and understanding the financial implications of running AI models at scale.
Range
The cost per inference is measured in monetary units (e.g., USD). The range varies widely depending on the complexity of the model, the resources used, and the pricing model of AWS services.
Response quality
Description
For generative models, response quality metrics evaluate the coherence, relevance, and overall quality of the output generated by the model. This metric is particularly important in applications involving text or image generation.
Range
Response quality can be measured through various scoring mechanisms, such as BLEU scores for text or FID scores for images, often ranging from 0 to 1 or as absolute scores where higher values indicate better quality.
Google Vertex AI
Google Vertex AI is a unified artificial intelligence (AI) platform that enables data scientists and machine learning engineers to build, deploy, and scale machine learning models seamlessly. Vertex AI brings together all the necessary tools for the entire machine learning workflow, including data preparation, model training, tuning, and deployment, under one platform. By integrating with Google Cloud’s ecosystem, Vertex AI simplifies the management of models in production and offers powerful features like AutoML, custom training, hyperparameter tuning, and advanced MLOps capabilities. This platform is designed to reduce complexity and accelerate the development of AI applications, making it accessible for both beginners and experts in machine learning.
Metrics Provided by Google Vertex AI
Google Vertex AI provides a variety of metrics that are essential for monitoring and optimizing machine learning models throughout their lifecycle. Below are some of the key metrics, along with descriptions and typical ranges:
1. Training Time
- Description: Training time measures the total time taken to train a machine learning model. It is a critical metric for understanding the efficiency of the training process and for planning resource allocation.
- Range: Training time is typically measured in seconds, minutes, or hours, depending on the size of the dataset and the complexity of the model. It can range from a few minutes for simple models to several hours or days for more complex models.
2. Training Accuracy
- Description: Training accuracy represents the percentage of correct predictions made by the model on the training dataset. It is a key metric for evaluating how well the model has learned from the training data.
- Range: Training accuracy is expressed as a percentage, ranging from 0% to 100%. Higher accuracy indicates that the model is performing well on the training data.
3. Validation Accuracy
- Description: Validation accuracy measures the model’s performance on a validation dataset, which is separate from the training data. It is used to assess the model’s ability to generalize to new, unseen data.
- Range: Like training accuracy, validation accuracy is expressed as a percentage, ranging from 0% to 100%. A high validation accuracy suggests good generalization, while a significant gap between training and validation accuracy may indicate overfitting.
4. Loss
- Description: Loss is a measure of how far the model’s predictions are from the actual outcomes. It serves as the optimization objective during training, with the goal of minimizing the loss.
- Range: Loss is usually measured as a non-negative number, with lower values indicating better model performance. The specific range depends on the loss function used, but it typically ranges from 0 to a small positive value.
5. Model Inference Latency
- Description: Inference latency measures the time taken for a deployed model to produce predictions on new input data. This metric is crucial for applications requiring quick responses, such as real-time decision-making systems.
- Range: Latency is typically measured in milliseconds (ms). Lower latency (e.g., under 100ms) is preferred for real-time applications, but the acceptable range depends on the specific use case.
6. Model Throughput
- Description: Throughput refers to the number of predictions a model can generate per second. It is an essential metric for understanding the model’s efficiency and scalability in production environments.
- Range: Throughput is measured in predictions per second (PPS), and the range can vary from tens to thousands, depending on the model’s complexity and the infrastructure.
7. CPU/GPU Utilization
- Description: This metric tracks the percentage of CPU or GPU resources utilized during training or inference. Monitoring resource utilization helps in optimizing costs and ensuring that resources are efficiently used.
- Range: Utilization is measured as a percentage, typically ranging from 0% to 100%. Efficient use of resources is essential to balance performance and cost, and high utilization may indicate the need to scale resources.
8. Memory Utilization
- Description: Memory utilization measures the amount of memory consumed during training or inference. This metric is important to prevent memory bottlenecks that can cause slowdowns or crashes.
- Range: Memory utilization is measured in bytes or as a percentage of total available memory. It can range from a few megabytes (MB) to several gigabytes (GB), depending on the model and data.
9. Hyperparameter Tuning Metrics
- Description: During hyperparameter tuning, Vertex AI provides metrics such as the best objective metric value, which reflects the optimal performance achieved during the tuning process. These metrics are essential for selecting the best model configuration.
- Range: The range depends on the specific objective metric being optimized, such as accuracy or loss. Accuracy might range from 0% to 100%, while loss values typically range from 0 to a small positive number.
10. Error Rate
- Description: Error rate measures the frequency of incorrect predictions or failures during inference. This metric is vital for assessing the reliability of a deployed model.
- Range: Error rate is expressed as a percentage, with lower values (e.g., below 1%) indicating more reliable model performance.
11. Cost per Inference
- Description: This metric measures the cost associated with each inference made by the model. It is important for budgeting and understanding the financial impact of deploying machine learning models at scale.
- Range: Cost per inference is measured in monetary units (e.g., USD) and varies depending on the complexity of the model, the resources used, and the pricing structure of Google Cloud services.
12. Model Drift
- Description: Model drift refers to the change in model performance over time as the data distribution evolves. It’s a key metric for ensuring that the model remains accurate and relevant in production.
- Range: Model drift is often measured as a percentage change in key performance metrics such as accuracy or loss over time. Significant drift may indicate the need for model retraining.
13. AutoML Model Performance
- Description: For models trained using AutoML in Vertex AI, this metric provides insights into how well the automatically generated models are performing. It includes metrics like accuracy, precision, recall, and F1-score.
- Range: These performance metrics are typically expressed as percentages or scores ranging from 0 to 1. Higher values indicate better model performance, with ranges depending on the specific task (e.g., classification vs. regression).
14. Pipeline Execution Time
- Description: For models deployed through Vertex AI Pipelines, this metric tracks the total time taken for a pipeline to execute, from data ingestion to model deployment. It helps in optimizing pipeline efficiency.
- Range: Pipeline execution time is measured in minutes or hours, depending on the complexity of the pipeline and the tasks involved.
Azure OpenAI
Azure OpenAI Service is a powerful platform provided by Microsoft Azure that allows developers and data scientists to access and integrate advanced AI models from OpenAI, such as GPT, DALL-E, and Codex, into their applications. The service provides the infrastructure to deploy and scale these models while leveraging Azure’s robust ecosystem for security, compliance, and management. Azure OpenAI enables users to build intelligent applications with capabilities like natural language understanding, content generation, code automation, and more, making it easier to implement AI-driven solutions across various industries.
Metrics Provided by Azure OpenAI Service
Azure OpenAI Service provides several key metrics to help users monitor and optimize the performance of AI models during development, deployment, and inference. Below are some of the most important metrics, along with their descriptions and typical ranges:
1. Inference Latency
- Description: Inference latency measures the time taken by the AI model to process an input and generate an output. This metric is crucial for applications where quick responses are needed, such as chatbots or real-time content generation.
- Range: Latency is typically measured in milliseconds (ms). Lower latency (e.g., under 100ms) is ideal for real-time applications, though acceptable ranges vary based on the specific use case.
2. Request Throughput
- Description: Request throughput refers to the number of requests the AI model can handle per second. This metric is essential for understanding the scalability of the model and ensuring it can handle the expected load in production environments.
- Range: Throughput is measured in requests per second (RPS) and can range from tens to thousands depending on the model’s complexity and the infrastructure used.
3. Token Utilization
- Description: Token utilization tracks the number of tokens processed during inference, including both input and output tokens. This metric is important for cost management, as many AI models, like GPT, are priced based on token usage.
- Range: Token count varies depending on the length of the input and the output generated. It can range from a few tokens for short inputs to several hundred tokens for longer interactions.
4. Success Rate
- Description: The success rate measures the percentage of successful inferences or API calls made to the model without errors. This metric is crucial for assessing the reliability of the service.
- Range: Success rate is expressed as a percentage, typically ranging from 0% to 100%. A higher success rate (closer to 100%) indicates more reliable performance.
5. Model Accuracy (Task-Specific)
- Description: For certain applications, such as classification or content generation, model accuracy indicates how well the model’s outputs align with the expected results. This metric varies depending on the task and model configuration.
- Range: Accuracy is usually expressed as a percentage, with ranges from 0% to 100%. Higher accuracy indicates better model performance on the given task.
6. Compute Utilization
- Description: Compute utilization tracks the percentage of CPU or GPU resources used by the model during inference. This metric helps in optimizing resource allocation and managing costs effectively.
- Range: Utilization is measured as a percentage, typically ranging from 0% to 100%. High utilization indicates that resources are being fully leveraged, but excessive utilization might necessitate scaling resources.
7. Memory Utilization
- Description: Memory utilization measures the amount of memory used during model inference. Monitoring this metric is crucial to prevent memory-related bottlenecks and ensure smooth operation.
- Range: Memory utilization is measured in bytes or as a percentage of total available memory. Depending on the model and data size, this can range from a few megabytes (MB) to several gigabytes (GB).
8. Error Rate
- Description: Error rate measures the frequency of errors encountered during API calls or model inferences. This metric is important for identifying issues with model performance or infrastructure.
- Range: Error rate is expressed as a percentage, with lower values (e.g., below 1%) indicating more reliable model performance.
9. Cost per Request
- Description: This metric tracks the cost associated with each request made to the AI model. It is vital for budgeting and understanding the financial implications of deploying AI models at scale.
- Range: Cost per request is measured in monetary units (e.g., USD) and varies depending on the model complexity, the resources used, and the pricing structure of Azure services.
10. Response Quality
- Description: For generative models, response quality metrics evaluate the relevance, coherence, and overall quality of the output generated by the model. This is particularly important in applications like content creation or conversational AI.
- Range: Response quality can be assessed using various scoring methods, often ranging from 0 to 1 or as qualitative assessments. Higher scores indicate better quality.
11. Rate Limits and Throttling
- Description: This metric monitors the frequency of hitting rate limits or experiencing throttling during API calls. Understanding this helps in managing API usage and scaling appropriately.
- Range: This is typically a count of incidents, with a higher count indicating that the current rate limits are being exceeded, requiring adjustments to usage patterns or plan levels.
12. User Engagement Metrics
- Description: These metrics measure how end-users interact with the AI models, such as click-through rates, engagement duration, or satisfaction scores. They are essential for understanding the effectiveness of AI-driven features in user-facing applications.
- Range: Engagement metrics vary widely based on the application but are often expressed as percentages or absolute counts (e.g., clicks, time spent).
13. Model Drift
- Description: Model drift tracks changes in model performance over time as the underlying data distribution changes. It’s crucial for maintaining the relevance and accuracy of AI models in production.
- Range: Model drift is usually measured as a percentage change in key performance metrics like accuracy or error rate over time. Significant drift may require retraining or updating the model.
14. Response Time Variability
- Description: This metric measures the variability in response times for model inferences, helping to identify inconsistencies or potential issues with the service.
- Range: Response time variability is often measured as a standard deviation or range of response times in milliseconds (ms). Lower variability indicates more consistent performance.
NVIDIA DGX
NVIDIA DGX Cloud is a high-performance, scalable cloud-based platform designed to accelerate AI and machine learning workloads. Built on NVIDIA’s advanced infrastructure, DGX Cloud provides enterprises with the power of NVIDIA DGX systems combined with the flexibility of the cloud. It is optimized for training large-scale AI models, running complex simulations, and deploying AI applications in production. DGX Cloud integrates seamlessly with other cloud services, allowing organizations to leverage NVIDIA’s cutting-edge GPUs, software stack, and AI frameworks to build, train, and deploy AI models faster and more efficiently.
Metrics Provided by NVIDIA DGX Cloud
NVIDIA DGX Cloud provides a range of metrics to monitor and optimize the performance of AI and machine learning workloads. These metrics are essential for managing resources, ensuring optimal performance, and controlling costs in large-scale AI projects. Below are some key metrics, along with their descriptions and typical ranges:
1. GPU Utilization
- Description: GPU utilization measures the percentage of GPU resources used during training or inference. This metric is crucial for understanding how effectively the GPUs are being utilized and whether there’s a need to optimize workloads or scale resources.
- Range: GPU utilization is typically expressed as a percentage, ranging from 0% to 100%. Higher utilization indicates that the GPUs are being fully leveraged, while lower utilization might suggest underutilization or inefficiencies in the workload.
2. GPU Memory Utilization
- Description: This metric tracks the amount of GPU memory being used during model training or inference. Monitoring GPU memory utilization helps prevent memory bottlenecks that could slow down or halt processing.
- Range: GPU memory utilization is measured in bytes (e.g., GB) or as a percentage of total available memory. The range can vary significantly depending on the model size and data batch sizes, typically from a few gigabytes to several tens of gigabytes.
3. Training Time
- Description: Training time measures the total duration required to train a model on DGX Cloud. This metric is essential for evaluating the efficiency of the training process and optimizing resource usage.
- Range: Training time is measured in minutes, hours, or even days, depending on the complexity of the model and the size of the dataset. It can range from a few minutes for smaller models to several hours or more for large-scale models.
4. Inference Latency
- Description: Inference latency refers to the time taken for a model to produce a prediction or result after receiving input data. This metric is critical for applications requiring real-time or low-latency predictions, such as autonomous vehicles or real-time analytics.
- Range: Inference latency is typically measured in milliseconds (ms). Lower latency is generally preferred, with acceptable ranges varying depending on the specific application’s requirements.
5. Model Throughput
- Description: Throughput measures the number of inferences or training iterations that can be processed per second. This metric is important for understanding the scalability and efficiency of AI workloads on DGX Cloud.
- Range: Throughput is measured in inferences per second (IPS) or training iterations per second, depending on the workload. The range can vary from tens to thousands, depending on the model and the available resources.
6. Disk I/O Utilization
- Description: Disk I/O utilization tracks the read and write operations on the storage disks during training or inference. This metric helps in identifying potential bottlenecks in data loading or storage management.
- Range: Disk I/O is measured in input/output operations per second (IOPS) or as a percentage of total available bandwidth. Higher values indicate more intensive disk usage, which might require optimization or scaling of storage resources.
7. Network Utilization
- Description: Network utilization measures the bandwidth used for data transfer between GPUs, storage, and other nodes in a distributed training setup. This metric is vital for optimizing data transfer rates and minimizing bottlenecks in distributed AI workflows.
- Range: Network utilization is measured in bits per second (bps) or as a percentage of available network bandwidth. It can range from a few megabits per second (Mbps) to several gigabits per second (Gbps), depending on the workload.
8. Job Queue Time
- Description: Job queue time measures the time a training or inference job spends waiting in the queue before execution begins. This metric is important for understanding system load and optimizing job scheduling.
- Range: Queue time is typically measured in seconds or minutes. Lower queue times indicate more efficient resource allocation, while higher queue times may suggest the need for additional resources or better scheduling practices.
9. Energy Consumption
- Description: Energy consumption measures the amount of power used by the GPUs and other infrastructure during training or inference. This metric is increasingly important for managing the sustainability and cost-efficiency of AI workloads.
- Range: Energy consumption is typically measured in kilowatt-hours (kWh). The range can vary depending on the scale of the workload, with larger models and longer training times consuming more energy.
10. Cost per Training/Inference
- Description: This metric tracks the cost associated with each training or inference operation on DGX Cloud. It is essential for budgeting and managing the financial impact of running large-scale AI workloads.
- Range: Cost is typically measured in monetary units (e.g., USD). The range varies depending on the model complexity, duration of training, and the resources used, and can range from a few dollars to thousands of dollars for extensive training jobs.
11. Temperature Monitoring
- Description: Temperature monitoring tracks the operating temperature of GPUs and other hardware components. This metric is crucial for ensuring that the hardware operates within safe temperature ranges, preventing overheating and potential damage.
- Range: Temperature is typically measured in degrees Celsius (°C). Optimal operating temperatures usually range from 30°C to 80°C, depending on the specific hardware components and workload intensity.
12. Model Convergence
- Description: Model convergence measures how quickly a model’s loss function reaches a minimum during training. It is an important metric for assessing the effectiveness of the training process and whether the model is learning as expected.
- Range: Convergence is usually assessed by plotting the loss over time or epochs, with the goal being a steady decrease in loss values. The specific range varies depending on the model and training parameters.
13. Error Rate
- Description: Error rate measures the frequency of errors or failed operations during training or inference. This metric helps in identifying issues with model performance or infrastructure.
- Range: Error rate is expressed as a percentage, with lower values indicating more reliable performance. Ideally, the error rate should be as close to 0% as possible.
14. Job Completion Time
- Description: Job completion time tracks the total time taken for a training or inference job to complete from start to finish. This metric is essential for assessing the efficiency and productivity of AI workflows.
- Range: Completion time is measured in minutes or hours, depending on the complexity of the job. It can range from a few minutes for small tasks to several hours or more for large-scale jobs.
AWS SageMaker
AWS SageMaker is a fully managed service that provides developers and data scientists with the tools to build, train, and deploy machine learning (ML) models at scale. SageMaker simplifies the entire ML workflow, from data preparation and model training to deployment and monitoring, allowing users to quickly iterate on models and bring them to production. With SageMaker, you can build models using popular ML frameworks, automatically tune hyperparameters, deploy models with a few clicks, and monitor model performance with integrated tools. SageMaker is designed to reduce the complexity and cost of building ML models, making it accessible for both beginners and experts in machine learning.
Metrics Provided by AWS SageMaker
AWS SageMaker offers a wide range of metrics to help users monitor and optimize the performance of their ML models throughout the entire machine learning lifecycle. Below are some of the key metrics, along with their descriptions and typical ranges:
1. Training Time
- Description: Training time measures the total duration taken to train a machine learning model. This metric is crucial for understanding the efficiency of the training process and can be used to optimize resource usage.
- Range: Training time is usually measured in seconds or minutes. The range varies depending on the complexity of the model and the size of the dataset, from a few minutes to several hours.
2. Training Accuracy
- Description: Training accuracy indicates the proportion of correct predictions made by the model on the training dataset. This metric is essential for evaluating how well the model has learned from the training data.
- Range: Training accuracy is expressed as a percentage, typically ranging from 0% to 100%. Higher accuracy indicates better performance on the training data.
3. Validation Accuracy
- Description: Validation accuracy measures the model’s performance on a separate validation dataset that was not used during training. This metric helps assess the model’s ability to generalize to new data.
- Range: Like training accuracy, validation accuracy is expressed as a percentage, ranging from 0% to 100%. A significant difference between training and validation accuracy may indicate overfitting.
4. Loss
- Description: Loss is a measure of how well the model’s predictions match the actual outcomes. It is used as an optimization objective during training, with the goal of minimizing the loss.
- Range: Loss is usually measured as a non-negative number, with lower values indicating better model performance. The range depends on the loss function used, but it typically ranges from 0 to a small positive value.
5. Hyperparameter Tuning Metrics
- Description: During hyperparameter tuning, SageMaker provides metrics such as the best objective metric value, which reflects the best performance achieved during the tuning process. These metrics are crucial for selecting the optimal model configuration.
- Range: The range depends on the specific objective metric (e.g., accuracy, loss) being optimized. It typically ranges from 0% to 100% for accuracy or from 0 to a small positive value for loss.
6. Model Inference Latency
- Description: Inference latency measures the time taken for a deployed model to produce predictions on new data. This metric is critical for real-time applications where response time is crucial.
- Range: Latency is measured in milliseconds (ms). Lower latency (e.g., under 100ms) is preferred for real-time applications, though the acceptable range depends on the use case.
7. Model Throughput
- Description: Throughput indicates the number of predictions a deployed model can generate per second. This metric helps assess the model’s scalability and efficiency in production environments.
- Range: Throughput is measured in predictions per second (PPS) and can range from tens to thousands depending on the model and infrastructure.
8. CPU/GPU Utilization
- Description: These metrics track the percentage of CPU or GPU resources used during training or inference. Monitoring resource utilization helps in optimizing costs and ensuring that resources are efficiently used.
- Range: Utilization is measured as a percentage, typically ranging from 0% to 100%. High utilization indicates that resources are being fully leveraged, but excessive utilization may require scaling up resources.
9. Memory Utilization
- Description: Memory utilization measures the amount of memory used during training or inference. This metric is important for preventing memory bottlenecks that can lead to slowdowns or failures.
- Range: Memory utilization is measured in bytes or as a percentage of total available memory. It can range from a few megabytes (MB) to several gigabytes (GB), depending on the model and data.
10. Error Rate
- Description: Error rate measures the frequency of errors during inference, such as incorrect predictions or failures in processing input data. This metric is vital for maintaining the reliability of deployed models.
- Range: Error rate is expressed as a percentage, with lower values (e.g., below 1%) indicating more reliable model performance.
11. Cost per Inference
- Description: This metric tracks the cost associated with each inference made by the model. It is essential for budgeting and understanding the financial impact of deploying ML models at scale.
- Range: Cost per inference is measured in monetary units (e.g., USD) and varies depending on the model complexity, the resources used, and the pricing model of AWS services.
12. Model Drift
- Description: Model drift measures changes in model performance over time as the data distribution evolves. It’s an important metric for maintaining model accuracy and ensuring that the model continues to perform well in production.
- Range: Model drift is often measured as a percentage change in key performance metrics like accuracy or loss over time. Higher percentages indicate more significant drift, which may require model retraining.
[/vc_column_text]
AWS Bedrock
| Feature | Description | Range | Severity | Security feature | Aggregation |
|---|---|---|---|---|---|
| Model Drift | Model drift measures the change in model performance over time as the data distribution changes. This metric is vital for the long-term maintenance of the model to ensure it continues to perform well in production. | Model drift is typically measured as a percentage change in key performance metrics like accuracy or error rate over time. A higher percentage indicates more significant drift, which may require model retraining or updates. | |||
| Inference Latency | Inference latency measures the time taken for the model to process an input and generate a response. This metric is crucial for applications where response time is critical such as chatbots or real-time image generation. | Latency is usually measured in milliseconds (ms). Ideal ranges vary depending on the application, but lower latency (e.g) under 100ms) is often preferred for real-time applications. | |||
| Model Throughput | Throughput refers to the number of inferences a model can handle per second. It's an essential metric for understanding the scalability of your application and ensuring that it can handle the required load. | Throughput refers to the number of inferences per second (IPS). Higher values indicate better scalability. Depending on the model complexity, throughput can range from tens to thousands of IPS. | |||
| Accuracy | Accuracy measures the correctness of the model’s predictions or output. This metric is vital for applications where the quality of the generated content directly impacts the user experience such as text generation or recommendation systems. | Accuracy is typically expressed as a percentage or a score between 0 and 1. Higher accuracy (closer to 1 or 100%) indicates better performance, but this metric can vary based on the specific task and dataset. | |||
| Resource Utilization | This metric tracks the computational resources ( CPU, GPU memory) used by the model during the inference process. Monitoring resource utilization helps in optimizing costs and ensuring that the application runs efficiently. | Resource utilization is measured in percentages, indicating the proportion of available resources being used. Ideally, resource utilization should be optimized to balance performance and cost. | |||
| Error rate | Error rate indicates the frequency of errors encountered during model inference. This metric is critical for maintaining reliability and identifying potential issues with model performance. | The error rate is usually expressed as a percentage. Lower error rates (e.g., below 1%) are preferred, indicating more reliable model performance. | |||
| Cost per Inference | This metric measures the cost associated with each inference performed by the model. It’s essential for budgeting and understanding the financial implications of running AI models at scale. | The cost per inference is measured in monetary units (e.g., USD). The range varies widely depending on the complexity of the model, the resources used, and the pricing model of AWS services. | |||
| Response quality | For generative models, response quality metrics evaluate the coherence, relevance, and overall quality of the output generated by the model. This metric is particularly important in applications involving text or image generation. | Response quality can be measured through various scoring mechanisms, such as BLEU scores for text or FID scores for images, often ranging from 0 to 1 or as absolute scores where higher values indicate better quality. | |||
AWS Sagemaker
| Feature | Description | Range | Severity | Security feature | Aggregation |
|---|---|---|---|---|---|
| Training Time | Training time measures the total duration taken to train a machine learning model. This metric is crucial for understanding the efficiency of the training process and can be used to optimize resource usage. | Training time is usually measured in seconds or minutes. The range varies depending on the complexity of the model and the size of the dataset, from a few minutes to several hours. | |||
| Training Accuracy | Training accuracy indicates the proportion of correct predictions made by the model on the training dataset. This metric is essential for evaluating how well the model has learned from the training data. | Training accuracy is expressed as a percentage, typically ranging from 0% to 100%. Higher accuracy indicates better performance on the training data. | |||
| Validation Accuracy | Validation accuracy measures the model's performance on a separate validation dataset that was not used during training. This metric helps assess the model’s ability to generalize to new data. | validation accuracy is expressed as a percentage, ranging from 0% to 100%. A significant difference between training and validation accuracy may indicate overfitting. | |||
| Loss | Loss is a measure of how well the model’s predictions match the actual outcomes. It is used as an optimization objective during training, with the goal of minimizing the loss. | Loss is usually measured as a non-negative number, with lower values indicating better model performance. The range depends on the loss function used, but it typically ranges from 0 to a small positive value. | |||
| Hyperparameter Tuning Metrics | During hyperparameter tuning, SageMaker provides metrics such as the best objective metric value, which reflects the best performance achieved during the tuning process. These metrics are crucial for selecting the optimal model configuration. | The range depends on the specific objective metric (e.g., accuracy, loss) being optimized. It typically ranges from 0% to 100% for accuracy or from 0 to a small positive value for loss. | |||
| Model Inference Latency | During hyperparameter tuning, SageMaker provides metrics such as the best objective metric value, which reflects the best performance achieved during the tuning process. These metrics are crucial for selecting the optimal model configuration. | Latency is measured in milliseconds (ms). Lower latency (e.g., under 100ms) is preferred for real-time applications, though the acceptable range depends on the use case. | |||
| Model Throughput | Throughput indicates the number of predictions a deployed model can generate per second. This metric helps assess the model’s scalability and efficiency in production environments. | Throughput is measured in predictions per second (PPS) and can range from tens to thousands depending on the model and infrastructure. | |||
| CPU/GPU Utilization | These metrics track the percentage of CPU or GPU resources used during training or inference. Monitoring resource utilization helps in optimizing costs and ensuring that resources are efficiently used. | Utilization is measured as a percentage, typically ranging from 0% to 100%. High utilization indicates that resources are being fully leveraged, but excessive utilization may require scaling up resources. | |||
| Memory Utilization | Memory utilization measures the amount of memory used during training or inference. This metric is important for preventing memory bottlenecks that can lead to slowdowns or failures. | Memory utilization is measured in bytes or as a percentage of total available memory. It can range from a few megabytes (MB) to several gigabytes (GB), depending on the model and data. | |||
| Error Rate | Error rate measures the frequency of errors during inference, such as incorrect predictions or failures in processing input data. This metric is vital for maintaining the reliability of deployed models. | Error rate is expressed as a percentage, with lower values (e.g., below 1%) indicating more reliable model performance. | |||
| Cost per Inference | This metric tracks the cost associated with each inference made by the model. It is essential for budgeting and understanding the financial impact of deploying ML models at scale. | Cost per inference is measured in monetary units (e.g., USD) and varies depending on the model complexity, the resources used, and the pricing model of AWS services. | |||
| Model Drift | Model drift measures changes in model performance over time as the data distribution evolves. It’s an important metric for maintaining model accuracy and ensuring that the model continues to perform well in production. | Model drift is often measured as a percentage change in key performance metrics like accuracy or loss over time. Higher percentages indicate more significant drift, which may require model retraining. | |||
Google Vertex AI
| Feature | Description | Range | Severity | Security feature | |
|---|---|---|---|---|---|
| Training Time | Training time measures the total time taken to train a machine learning model. It is a critical metric for understanding the efficiency of the training process and for planning resource allocation. | Training time is typically measured in seconds, minutes, or hours, depending on the size of the dataset and the complexity of the model. It can range from a few minutes for simple models to several hours or days for more complex models. | |||
| Training Accuracy | Training accuracy represents the percentage of correct predictions made by the model on the training dataset. It is a key metric for evaluating how well the model has learned from the training data. | Training accuracy is expressed as a percentage, ranging from 0% to 100%. Higher accuracy indicates that the model is performing well on the training data. | |||
| Validation Accuracy | Validation accuracy measures the model’s performance on a validation dataset, which is separate from the training data. It is used to assess the model’s ability to generalize to new, unseen data. | Validation accuracy is expressed as a percentage, ranging from 0% to 100%. A high validation accuracy suggests good generalization, while a significant gap between training and validation accuracy may indicate overfitting. | |||
| Loss | Loss is a measure of how far the model’s predictions are from the actual outcomes. It serves as the optimization objective during training, with the goal of minimizing the loss. | Loss is usually measured as a non-negative number, with lower values indicating better model performance. The specific range depends on the loss function used, but it typically ranges from 0 to a small positive value. | |||
| Model Inference Latency | Inference latency measures the time taken for a deployed model to produce predictions on new input data. This metric is crucial for applications requiring quick responses, such as real-time decision-making systems. | Latency is typically measured in milliseconds (ms). Lower latency (e.g., under 100ms) is preferred for real-time applications, but the acceptable range depends on the specific use case. | |||
| Model Throughput | Throughput refers to the number of predictions a model can generate per second. It is an essential metric for understanding the model’s efficiency and scalability in production environments. | Throughput is measured in predictions per second (PPS), and the range can vary from tens to thousands, depending on the model’s complexity and the infrastructure. | |||
| CPU/GPU Utilization | This metric tracks the percentage of CPU or GPU resources utilized during training or inference. Monitoring resource utilization helps in optimizing costs and ensuring that resources are efficiently used. | Utilization is measured as a percentage, typically ranging from 0% to 100%. Efficient use of resources is essential to balance performance and cost, and high utilization may indicate the need to scale resources. | |||
| Memory Utilization | Memory utilization measures the amount of memory consumed during training or inference. This metric is important to prevent memory bottlenecks that can cause slowdowns or crashes. | Memory utilization is measured in bytes or as a percentage of total available memory. It can range from a few megabytes (MB) to several gigabytes (GB), depending on the model and data. | |||
| Hyperparameter Tuning Metrics | During hyperparameter tuning, Vertex AI provides metrics such as the best objective metric value, which reflects the optimal performance achieved during the tuning process. These metrics are essential for selecting the best model configuration. | The range depends on the specific objective metric being optimized, such as accuracy or loss. Accuracy might range from 0% to 100%, while loss values typically range from 0 to a small positive number. | |||
| Error Rate | Error rate measures the frequency of incorrect predictions or failures during inference. This metric is vital for assessing the reliability of a deployed model. | Error rate is expressed as a percentage, with lower values (e.g., below 1%) indicating more reliable model performance. | |||
| Cost per Inference | This metric measures the cost associated with each inference made by the model. It is important for budgeting and understanding the financial impact of deploying machine learning models at scale. | Cost per inference is measured in monetary units (e.g., USD) and varies depending on the complexity of the model, the resources used, and the pricing structure of Google Cloud services. | |||
| Model Drift | Model drift refers to the change in model performance over time as the data distribution evolves. It’s a key metric for ensuring that the model remains accurate and relevant in production. | Model drift is often measured as a percentage change in key performance metrics such as accuracy or loss over time. Significant drift may indicate the need for model retraining. | |||
| AutoML Model Performance | For models trained using AutoML in Vertex AI, this metric provides insights into how well the automatically generated models are performing. It includes metrics like accuracy, precision, recall, and F1-score. | These performance metrics are typically expressed as percentages or scores ranging from 0 to 1. Higher values indicate better model performance, with ranges depending on the specific task (e.g., classification vs. regression). | |||
| Pipeline Execution Time | For models deployed through Vertex AI Pipelines, this metric tracks the total time taken for a pipeline to execute, from data ingestion to model deployment. It helps in optimizing pipeline efficiency. | Pipeline execution time is measured in minutes or hours, depending on the complexity of the pipeline and the tasks involved. | |||
Azure OpenAI
| Feature | Description | Range | Severity | Security feature | Aggregation |
|---|---|---|---|---|---|
| Inference Latency | Inference latency measures the time taken by the AI model to process an input and generate an output. This metric is crucial for applications where quick responses are needed, such as chatbots or real-time content generation. | Latency is typically measured in milliseconds (ms). Lower latency (e.g., under 100ms) is ideal for real-time applications, though acceptable ranges vary based on the specific use case. | |||
| Request Throughput | Request throughput refers to the number of requests the AI model can handle per second. This metric is essential for understanding the scalability of the model and ensuring it can handle the expected load in production environments. | Throughput is measured in requests per second (RPS) and can range from tens to thousands depending on the model's complexity and the infrastructure used. | |||
| Token Utilization | Token utilization tracks the number of tokens processed during inference, including both input and output tokens. This metric is important for cost management, as many AI models, like GPT, are priced based on token usage. | Token count varies depending on the length of the input and the output generated. It can range from a few tokens for short inputs to several hundred tokens for longer interactions. | |||
| Success Rate | The success rate measures the percentage of successful inferences or API calls made to the model without errors. This metric is crucial for assessing the reliability of the service. | Success rate is expressed as a percentage, typically ranging from 0% to 100%. A higher success rate (closer to 100%) indicates more reliable performance. | |||
| Model Accuracy (Task-Specific) | For certain applications, such as classification or content generation, model accuracy indicates how well the model's outputs align with the expected results. This metric varies depending on the task and model configuration. | Accuracy is usually expressed as a percentage, with ranges from 0% to 100%. Higher accuracy indicates better model performance on the given task. | |||
| Compute Utilization | Compute utilization tracks the percentage of CPU or GPU resources used by the model during inference. This metric helps in optimizing resource allocation and managing costs effectively. | Utilization is measured as a percentage, typically ranging from 0% to 100%. High utilization indicates that resources are being fully leveraged, but excessive utilization might necessitate scaling resources. | |||
| Memory Utilization | Memory utilization measures the amount of memory used during model inference. Monitoring this metric is crucial to prevent memory-related bottlenecks and ensure smooth operation. | Memory utilization is measured in bytes or as a percentage of total available memory. Depending on the model and data size, this can range from a few megabytes (MB) to several gigabytes (GB). | |||
| Error Rate | Error rate measures the frequency of errors encountered during API calls or model inferences. This metric is important for identifying issues with model performance or infrastructure. | Error rate is expressed as a percentage, with lower values (e.g., below 1%) indicating more reliable model performance. | |||
| Cost per Request | This metric tracks the cost associated with each request made to the AI model. It is vital for budgeting and understanding the financial implications of deploying AI models at scale. | Cost per request is measured in monetary units (e.g., USD) and varies depending on the model complexity, the resources used, and the pricing structure of Azure services. | |||
| Response Quality | For generative models, response quality metrics evaluate the relevance, coherence, and overall quality of the output generated by the model. This is particularly important in applications like content creation or conversational AI. | Response quality can be assessed using various scoring methods, often ranging from 0 to 1 or as qualitative assessments. Higher scores indicate better quality. | |||
| Rate Limits and Throttling | This metric monitors the frequency of hitting rate limits or experiencing throttling during API calls. Understanding this helps in managing API usage and scaling appropriately. | This is typically a count of incidents, with a higher count indicating that the current rate limits are being exceeded, requiring adjustments to usage patterns or plan levels. | |||
| User Engagement Metrics | These metrics measure how end-users interact with the AI models, such as click-through rates, engagement duration, or satisfaction scores. They are essential for understanding the effectiveness of AI-driven features in user-facing applications. | Engagement metrics vary widely based on the application but are often expressed as percentages or absolute counts (e.g., clicks, time spent). | |||
| Model Drift | Model drift tracks changes in model performance over time as the underlying data distribution changes. It’s crucial for maintaining the relevance and accuracy of AI models in production. | Model drift is usually measured as a percentage change in key performance metrics like accuracy or error rate over time. Significant drift may require retraining or updating the model. | |||
| Response Time Variability | This metric measures the variability in response times for model inferences, helping to identify inconsistencies or potential issues with the service. | Response time variability is often measured as a standard deviation or range of response times in milliseconds (ms). Lower variability indicates more consistent performance. | |||
NVIDIA DGX
| Feature | Description | Range | Severity | Security feature | Aggregation |
|---|---|---|---|---|---|
| GPU Utilization | GPU utilization measures the percentage of GPU resources used during training or inference. This metric is crucial for understanding how effectively the GPUs are being utilized and whether there’s a need to optimize workloads or scale resources. | GPU utilization is typically expressed as a percentage, ranging from 0% to 100%. Higher utilization indicates that the GPUs are being fully leveraged, while lower utilization might suggest underutilization or inefficiencies in the workload. | |||
| GPU Memory Utilization | This metric tracks the amount of GPU memory being used during model training or inference. Monitoring GPU memory utilization helps prevent memory bottlenecks that could slow down or halt processing. | GPU memory utilization is measured in bytes (e.g., GB) or as a percentage of total available memory. The range can vary significantly depending on the model size and data batch sizes, typically from a few gigabytes to several tens of gigabytes. | |||
| Training Time | Training time measures the total duration required to train a model on DGX Cloud. This metric is essential for evaluating the efficiency of the training process and optimizing resource usage. | Training time is measured in minutes, hours, or even days, depending on the complexity of the model and the size of the dataset. It can range from a few minutes for smaller models to several hours or more for large-scale models. | |||
| Inference Latency | Inference latency refers to the time taken for a model to produce a prediction or result after receiving input data. This metric is critical for applications requiring real-time or low-latency predictions, such as autonomous vehicles or real-time analytics. | Inference latency is typically measured in milliseconds (ms). Lower latency is generally preferred, with acceptable ranges varying depending on the specific application’s requirements. | |||
| Model Throughput | Throughput measures the number of inferences or training iterations that can be processed per second. This metric is important for understanding the scalability and efficiency of AI workloads on DGX Cloud. | Throughput is measured in inferences per second (IPS) or training iterations per second, depending on the workload. The range can vary from tens to thousands, depending on the model and the available resources. | |||
| Disk I/O Utilization | Disk I/O utilization tracks the read and write operations on the storage disks during training or inference. This metric helps in identifying potential bottlenecks in data loading or storage management. | Disk I/O is measured in input/output operations per second (IOPS) or as a percentage of total available bandwidth. Higher values indicate more intensive disk usage, which might require optimization or scaling of storage resources. | |||
| Network Utilization | Network utilization measures the bandwidth used for data transfer between GPUs, storage, and other nodes in a distributed training setup. This metric is vital for optimizing data transfer rates and minimizing bottlenecks in distributed AI workflows. | Network utilization is measured in bits per second (bps) or as a percentage of available network bandwidth. It can range from a few megabits per second (Mbps) to several gigabits per second (Gbps), depending on the workload. | |||
| Job Queue Time | Job queue time measures the time a training or inference job spends waiting in the queue before execution begins. This metric is important for understanding system load and optimizing job scheduling. | Queue time is typically measured in seconds or minutes. Lower queue times indicate more efficient resource allocation, while higher queue times may suggest the need for additional resources or better scheduling practices. | |||
| Energy Consumption | Energy consumption measures the amount of power used by the GPUs and other infrastructure during training or inference. This metric is increasingly important for managing the sustainability and cost-efficiency of AI workloads. | Energy consumption is typically measured in kilowatt-hours (kWh). The range can vary depending on the scale of the workload, with larger models and longer training times consuming more energy. | |||
| Cost per Training/Inference | This metric tracks the cost associated with each training or inference operation on DGX Cloud. It is essential for budgeting and managing the financial impact of running large-scale AI workloads. | Cost is typically measured in monetary units (e.g., USD). The range varies depending on the model complexity, duration of training, and the resources used, and can range from a few dollars to thousands of dollars for extensive training jobs. | |||
| Temperature Monitoring | Temperature monitoring tracks the operating temperature of GPUs and other hardware components. This metric is crucial for ensuring that the hardware operates within safe temperature ranges, preventing overheating and potential damage. | Temperature is typically measured in degrees Celsius (°C). Optimal operating temperatures usually range from 30°C to 80°C, depending on the specific hardware components and workload intensity. | |||
| Model Convergence | Model convergence measures how quickly a model's loss function reaches a minimum during training. It is an important metric for assessing the effectiveness of the training process and whether the model is learning as expected. | Convergence is usually assessed by plotting the loss over time or epochs, with the goal being a steady decrease in loss values. The specific range varies depending on the model and training parameters. | |||
| Error Rate | Error rate measures the frequency of errors or failed operations during training or inference. This metric helps in identifying issues with model performance or infrastructure. | Error rate is expressed as a percentage, with lower values indicating more reliable performance. Ideally, the error rate should be as close to 0% as possible. | |||
| Job Completion Time | Job completion time tracks the total time taken for a training or inference job to complete from start to finish. This metric is essential for assessing the efficiency and productivity of AI workflows. | Completion time is measured in minutes or hours, depending on the complexity of the job. It can range from a few minutes for small tasks to several hours or more for large-scale jobs. | |||


No Comments